A Comprehensive Look into Mobile Internet Traffic
We now live in a world where it’s rare to find a person who doesn’t own a mobile phone or at least knows what it is. You can basically run your whole life using this handheld device. Of course, you use your phone to connect and socialise with other people. But also to improve your lifestyle, watch movies, play games, listen to music, pay bills, shop online, edit photos, and create content. Convenience, the popularity of smartphones, and the time spent on them all contribute to mobile phones dominating the world.
The fast-growing mobile internet traffic helps businesses and marketers advertise their brands better and reach more people. With the increasing mobile traffic, optimising a website for mobile screens is doing the bare minimum. The stakes are higher, so marketing campaigns and content creation must be tailored for mobile users. Read on as we dig deeper into mobile internet growth and all the factors that brands and marketers must consider for their subsequent marketing campaigns.
The Rise of Mobile
Mobile internet growth has been increasing drastically over the last decade. Here’s the global web traffic as of May 2024:
- 60.08% via mobile
- 37.85% via desktop
- 2.07% via tablet
Desktop traffic once dominated. However, in 2017, mobile traffic reached 51.56% compared to desktop’s 43.75%.
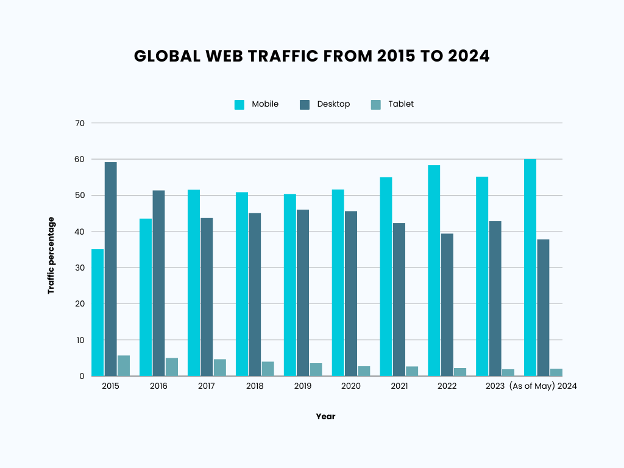
Here’s a closer look at the global web traffic percentage from 2015 to 2024.
| YEAR | MOBILE | DESKTOP | TABLET |
| 2015 | 35.10% | 59.17% | 5.73% |
| 2016 | 43.59% | 51.37% | 5.04% |
| 2017 | 51.56% | 43.75% | 4.69% |
| 2018 | 50.88% | 45.11% | 4.02% |
| 2019 | 50.39% | 46.04% | 3.75% |
| 2020 | 51.61% | 45.64% | 2.75% |
| 2021 | 55.01% | 42.31% | 2.69% |
| 2022 | 58.32% | 39.43% | 2.25% |
| 2023 | 55.19% | 42.88% | 1.94% |
| (As of May) 2024 | 60.08% | 37.85% | 2.07% |
Sources: https://www.oberlo.com/statistics/mobile-internet-traffic / https://gs.statcounter.com/platform-market-share/desktop-mobile-tablet/worldwide/
Many factors drive the exponential growth of mobile web traffic, including:
- Accessibility: Internet access is available in almost all private and public places. Mobile data is available when the traditional Wi-Fi set-up isn’t. As such, it’s very convenient to have your smartphone with you and browse online whenever you want. It’s the instant connection and access that people today crave.
- Affordability: There’s a smartphone for every budget. Phone manufacturers regularly release budget-friendly phones with premium features. And compared to a brand-new computer or laptop, getting a smartphone is relatively cheaper.
- Increased Network Speed: Thanks to 4G and the rise of 5G, mobile users can upload and download content faster. This leads to a speedy and seamless mobile experience.
The gap between mobile and desktop web traffic isn’t that large. It was always within 10% to 15% before 2024. That means businesses and marketers shouldn’t just abandon desktop users. After all, many people still use their computers to shop online, research, and engage in other online activities. However, they must optimise their content for mobile screens by focusing on responsive design, fast loading times, a touch-friendly interface, and increasing the visibility of mobile-specific content.
Mobile Traffic by Region
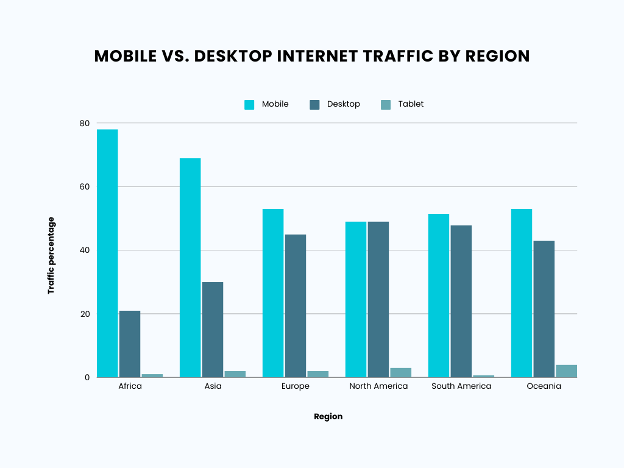
Here, we’ll explore how mobile web traffic flows in key regions across the globe as of May 2024.
| REGION | MOBILE WEB TRAFFIC | DESKTOP WEB TRAFFIC | TABLET WEB TRAFFIC |
| Africa | 77.79% | 21.13% | 1.08% |
| Asia | 68.74% | 29.5% | 1.76% |
| Europe | 52.52% | 45.15% | 2.33% |
| North America | 48.79% | 48.5% | 2.71% |
| South America | 51.44% | 47.87% | 0.69% |
| Oceania | 53.45% | 42.73% | 3.82% |
Source: https://gs.statcounter.com/platform-market-share/desktop-mobile-tablet/
On average:
- Mobile web traffic is 58.79%.
- Desktop web traffic is 39.15%.
- Tablet web traffic is 2.06%.
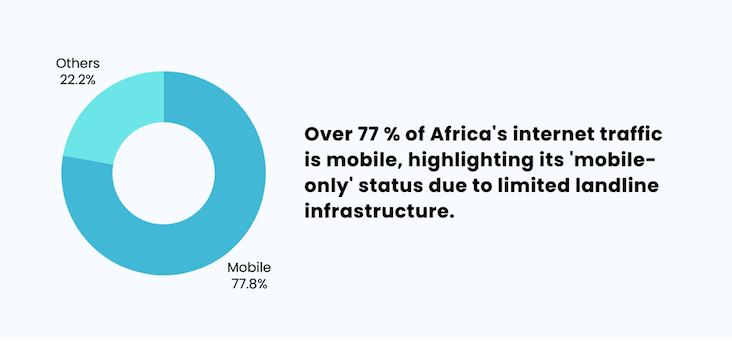
There are significant differences in mobile web traffic across regions. Africa has the highest mobile traffic share at over 77%, compared to North America’s 49%. Africa is often called a “mobile-only” continent due to less developed landline internet infrastructure, making mobile data plans more practical. Furthermore, more people in the region have “feature” mobile phones (non-smartphones) that generally have a long battery life. These phones are valuable in places with erratic electricity as they can last up to a week. Mobile phones also have a radio, an essential form of mass communication in Africa.
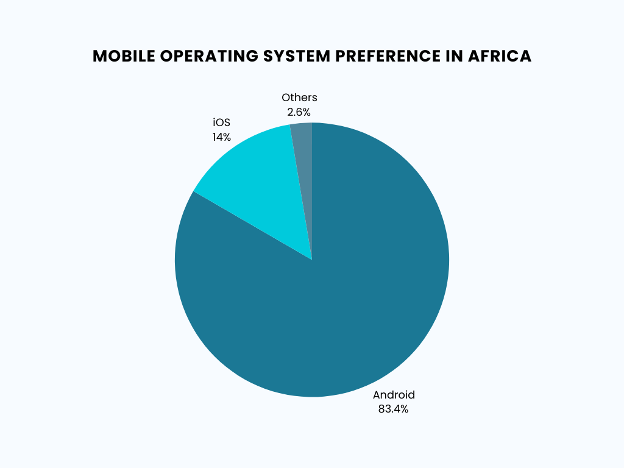
Affordability plays a huge factor as well. Over 80% of Africans use Android phones because they offer a wide price range, local apps, customisation, versatility, and accessibility. In some regions, Android is preferred due to brand loyalty and local marketing. Brands like Tecno and Infinix are popular because of strategic pricing and marketing.
On the other hand, North America is the world’s least mobile-centric region, with roughly 49%.
Mobile Traffic in the United States
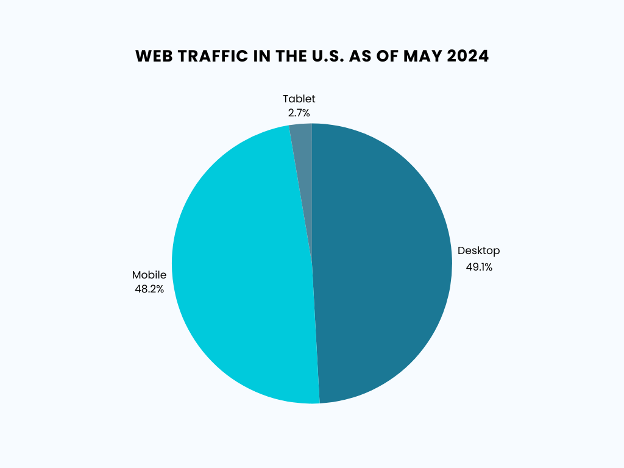
Here are the web traffic stats in the US as of May 2024:
- Desktop web traffic is 49.12%.
- Mobile web traffic is 48.23%.
- Tablet web traffic is 2.65%
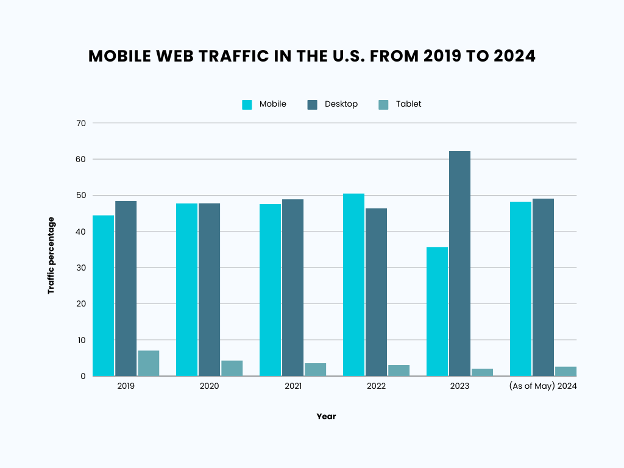
Here’s a rundown of web traffic in the US in the last five years:
| YEAR | MOBILE WEB TRAFFIC | DESKTOP WEB TRAFFIC | TABLET WEB TRAFFIC |
| 2019 | 44.47% | 48.45% | 7.08% |
| 2020 | 47.82% | 47.84% | 4.34% |
| 2021 | 47.57% | 48.88% | 3.56% |
| 2022 | 50.52% | 46.43% | 3.05% |
| 2023 | 35.73% | 62.21% | 2.07% |
| (As of May) 2024 | 48.23% | 49.12% | 2.65% |
Source: https://www.oberlo.com/statistics/mobile-internet-traffic
The distribution of mobile vs. desktop internet usage in the United States presents a fascinating contrast to the global trend. While statistics show a global shift towards mobile browsing, US consumers appear to buck this trend, favouring desktops. Before 2023, mobile and desktop usage was see-sawed, with a narrow gap separating their market shares.
However, a significant shift occurred in 2023, with desktops surging ahead. In particular, in October 2023, mobile web traffic in the US was only 29.15%, while desktop web traffic peaked at 69.28%. The reason for this vast difference is still unspecified, but cyber threats that month could be a factor.
US consumers’ affinity for desktop and laptop use over mobile stems from different factors, including:
- Generation: Baby boomers, Gen X, and older Millennials tend to be more comfortable using computers or laptops for complex online tasks.
- Work: Desktops and laptops are still the preferred work-related device, particularly in a professional setting.
- Accessibility Needs: Due to their large screens and keyboard options, users with dexterity limitations or visual impairments may find desktops more accessible than mobile phones.
Mobile Traffic in Select Countries
Let’s move beyond the US and see the top 20 countries with the highest mobile web traffic percentage as of January 2024:
| COUNTRY | MOBILE WEB TRAFFIC % | |
| 1 | Nigeria | 86.67% |
| 2 | Vietnam | 86.51% |
| 3 | South Africa | 80.9% |
| 4 | Saudi Arabia | 80.59% |
| 5 | India | 79% |
| 6 | Ghana | 78.19% |
| 7 | Kenya | 75.46% |
| 8 | Turkey | 74.65% |
| 9 | United Arab Emirates | 73.53% |
| 10 | Egypt | 70.8% |
| 11 | Morocco | 65.81% |
| 12 | Spain | 65.8% |
| 13 | Poland | 64.95% |
| 14 | China | 64.09% |
| 15 | Singapore | 62.18% |
| 16 | Ireland | 62.61% |
| 17 | Indonesia | 62.53% |
| 18 | Thailand | 60.39% |
| 19 | South Korea | 59.65% |
| 20 | Argentina | 58.62% |
Source: https://www.statista.com/statistics/430830/share-of-mobile-internet-traffic-countries/
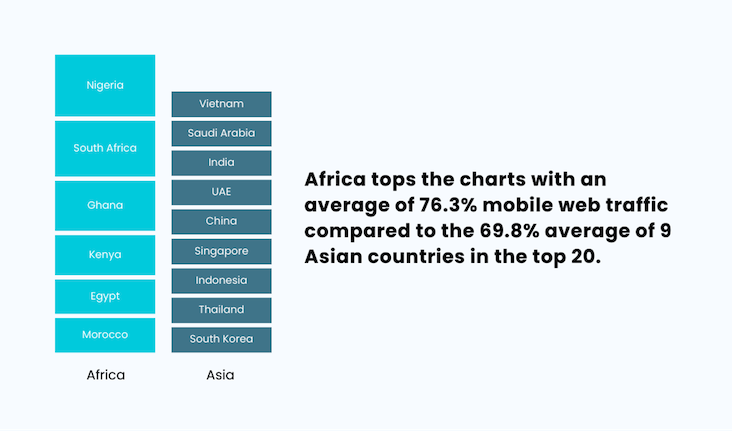
Surprisingly, there are nine Asian countries in the top 20 compared to six in Africa.
| ASIA | Vietnam, Saudi Arabia, India, China, Indonesia, Thailand, UAE, Singapore, South Korea |
| AFRICA | Nigeria, South Africa, Ghana, Kenya, Egypt, Morocco |
However, the African region still tops the charts with an average of 76.3% of mobile web traffic, against Asia’s 69.8%
On the other side of the spectrum, the bottom five countries with the lowest mobile web traffic percentage are:
| COUNTRY | MOBILE WEB TRAFFIC % | |
| 1 | Japan | 37.6% |
| 2 | Canada | 42.13% |
| 3 | Portugal | 42.16% |
| 4 | Belgium | 42.37% |
| 5 | New Zealand | 43.71% |
Interestingly, Japan enjoys some of the highest levels of connectivity globally but ranks last. The ranking isn’t about speed or innovation but about Japanese nuances in the digital world. The average Japanese only spends about 4.5 hours a day online, while the global average is 7 hours. They use social media in under an hour, 65% less than the worldwide average. They also rarely use new tools in search engines, like voice search. The Japanese culture is very considerate and courteous to others; for instance, talking on the phone on public transport is frowned upon.
Mobile vs. Other Devices in the US
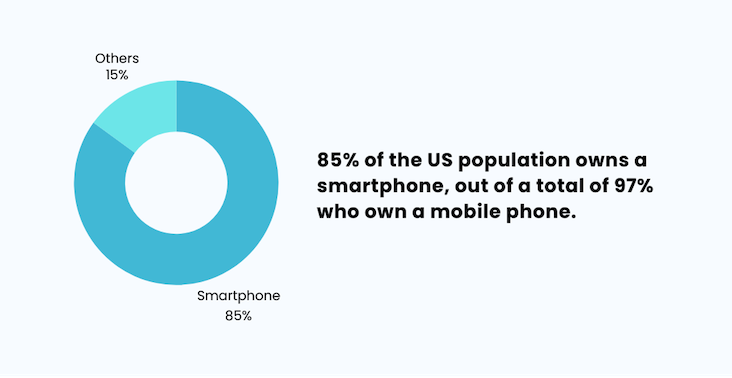
In the US, 97% of the population owns a mobile phone. From this percentage:
- 85% own a smartphone.
- 11% own a feature phone.
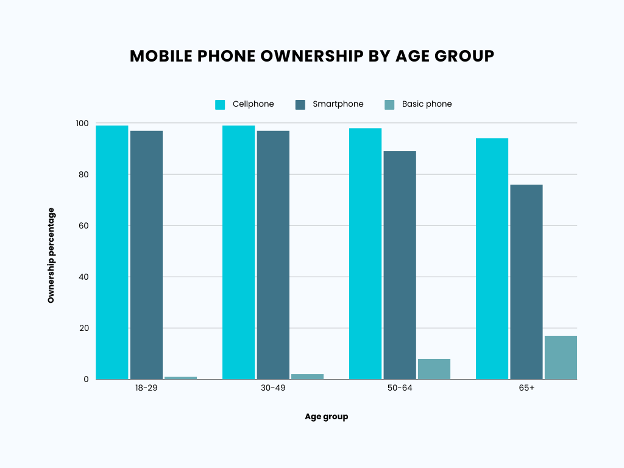
Let’s take a closer look by age group:
Cellphone Ownership by Age Group:
| AGE | CELLPHONE OWNERSHIP |
| 18-29 | 99% |
| 30-49 | 99% |
| 50-64 | 98% |
| 65+ | 94% |
Smartphone Ownership by Age Group:
| AGE | CELLPHONE OWNERSHIP |
| 18-29 | 97% |
| 30-49 | 97% |
| 50-64 | 89% |
| 65+ | 76% |
Cellphone Ownership (but not smartphone) by Age Group:
| AGE | CELLPHONE OWNERSHIP |
| 18-29 | 1% |
| 30-49 | 2% |
| 50-64 | 8% |
| 65+ | 17% |
Smartphone dominance is exceptionally high in all age groups, indicating that most Americans use it as the primary internet search and communication device.
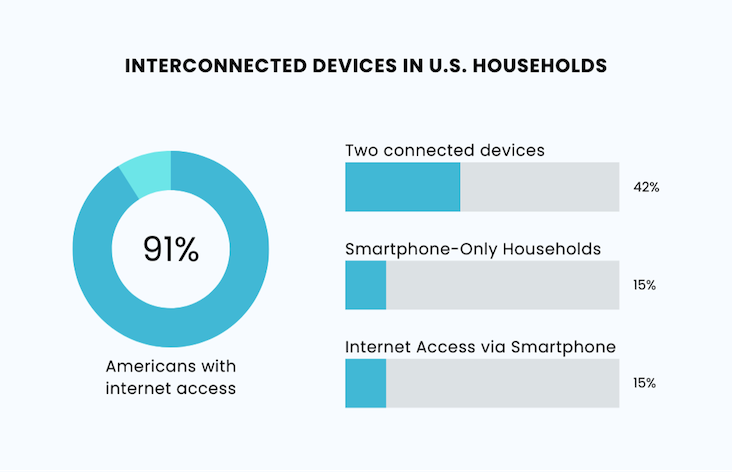
On average, American households have nearly six internet-connected devices.
- 42% of US households have two connected devices, one of which is a smartphone, and the other can be a laptop, a tablet, or a smartwatch.
- 15% of smartphone owners reside in “smartphone-only” households.
- 91% of Americans have internet access. However, 15% of adult Americans use their smartphones at home to access the internet. This is mainly due to broadband costs.
Mobile Device Activities
Mobile phones are used in various ways besides making and receiving phone calls. Here’s a breakdown by category.
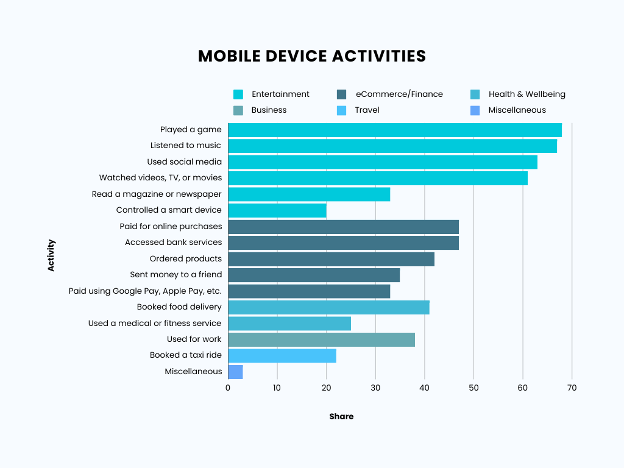
Entertainment:
| ACTIVITY | PERCENTAGE |
| Played a game | 68% |
| Listened to music | 67% |
| Used social media | 63% |
| Watched videos, TV, or movies | 61% |
| Read a magazine or newspaper | 33% |
| Controlled a smart device | 20% |
eCommerce/Finance:
| ACTIVITY | PERCENTAGE |
| Paid for online purchases | 47% |
| Accessed bank services | 47% |
| Ordered products | 42% |
| Sent money to a friend | 35% |
| Paid using Google Pay, Apple Pay, etc. | 33% |
Health & Wellbeing:
- Booked food delivery (41%)
- Used a medical or fitness service (25%)
Business:
- Used for work (38%)
Travel:
- Booked a taxi ride (22%)
Miscellaneous:
- Others (3%)
Common Sense Media reported that 97% of teens use their phones during school hours. On average, they check their phones over 50 times daily, with some checking them hundreds of times (peaking at 498 times). This daily phone use adds up to over four hours of screen time.
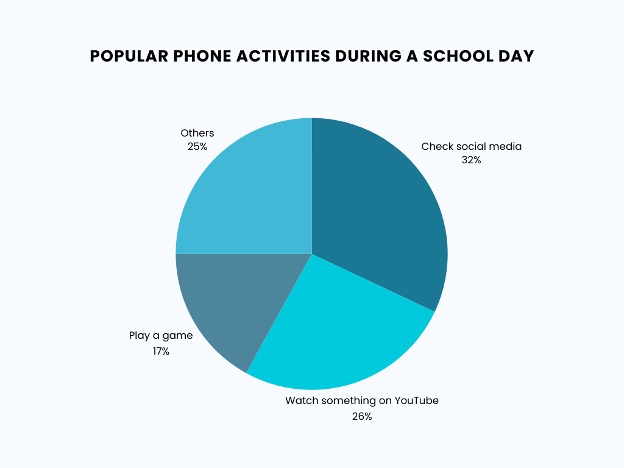
Students were most likely to do the following when they used their phones during the school day:
| TYPE OF PHONE USAGE | PERCENTAGE |
| Check social media | 32% |
| Watch something on YouTube | 26% |
| Play a game | 17% |
TikTok is these teens’ most visited social media app, with users averaging nearly two hours daily.
Mobile Internet Traffic by Browser
Learning which browser is commonly used by mobile users can help brands and marketers optimise their websites for a smooth user experience.
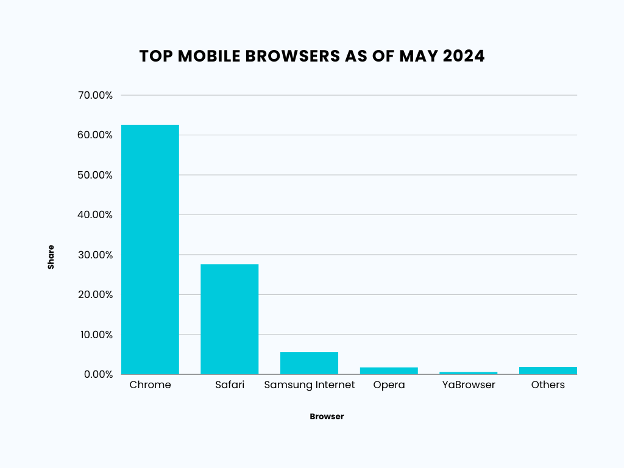
Here’s a breakdown of the top mobile browsers as of May 2024 using a year’s worth of data.
| BROWSER | PERCENTAGE |
| Chrome | 62.61% |
| Safari | 27.65% |
| Samsung Internet | 5.54% |
| Opera | 1.72% |
| YaBrowser | 0.6% |
| Others | 1.89% |
Since Chrome has the lion’s share, brands and marketers must prioritise web and app functionality for the browser. Chrome’s dominance isn’t a surprise, considering its close integration with key Google services like Gmail, YouTube, and Search. Chrome consistently has a fast loading speed and a simple yet intuitive interface.
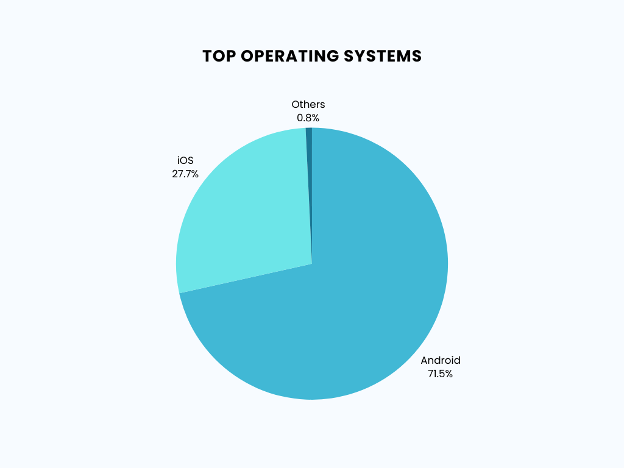
It’s also unsurprising that Android is the top operating system for mobile phones. Let’s examine the stark differences between Android and other operating systems.
| MOBILE OPERATING SYSTEM | PERCENTAGE |
| Android | 71.5% |
| iOS | 27.73% |
| Samsung | 0.38% |
| Unknown | 0.2% |
| KaiOS | 0.15% |
| Windows | 0.02% |
There are several reasons why mobile users prefer Android over other operating systems, particularly iOS. In terms of hardware choice, different phone manufacturers use this OS to offer various functionalities at different costs. This enables mobile users to choose a phone that best suits their needs and budget. Android phones also provide a higher degree of customisation so users can personalise their devices to their heart’s content.
Now let’s look at the most used mobile web browsers in different countries, grouped by browser:
Safari:
| COUNTRY | PERCENTAGE |
| United States | 55.05% |
| Australia | 52.81% |
| Saudi Arabia | 52.17% |
| United Kingdom | 49.5% |
| Japan | 49.29% |
| Canada | 46.23% |
Chrome:
| COUNTRY | PERCENTAGE |
| India | 90.56% |
| South Africa | 87.22% |
| Indonesia | 87.07% |
| Argentina | 83.33% |
| Philippines | 82.22% |
| Mexico | 76.99% |
| Brazil | 72.81% |
| France | 57.99% |
| Germany | 51.63% |
| New Zealand | 51.4% |
Opera:
| COUNTRY | PERCENTAGE |
| Norway | 59.58% |
Mobile App Market
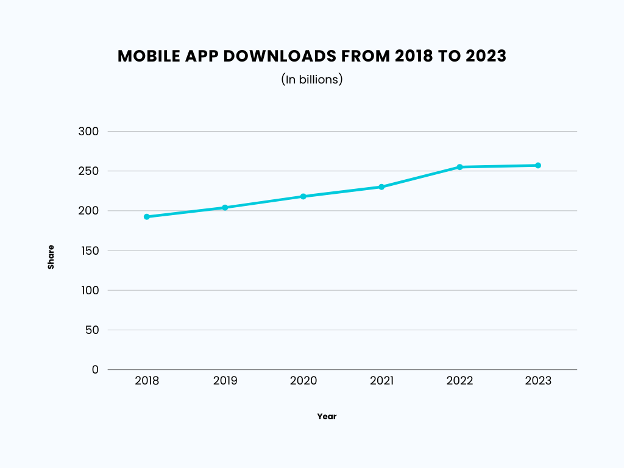
Sales from mobile apps will surpass $613 billion by 2025. Year on year, a billion-worth increase can be seen in the number of mobile app downloads:
| YEAR | NUMBER OF DOWNLOADS |
| 2018 | 192.45 billion downloads |
| 2019 | 204 billion downloads |
| 2020 | 218 billion downloads |
| 2021 | 230 billion downloads |
| 2022 | 255 billion downloads |
| 2023 | 257 billion downloads |
It’s worth noting that in 2023, global app downloads stalled at just a 1% increase from 2022.
The majority of mobile users obtain their mobile apps from only two places:
| Google Play Store | Android | 3.55 million apps available |
| Apple App Store | iOS | 1.64 million apps available |
Source: https://www.bankmycell.com/blog/number-of-mobile-apps-worldwide
The great thing about both stores is that they offer the top and latest apps, sometimes simultaneously, sometimes with a few days in between. The Apple App Store is good and is more organised for checking recommendations and featured picks. In contrast, the Google Play Store has a more straightforward app search that allows remote installation directly from the web browser onto your computer.
Impact of 5G on Mobile Traffic
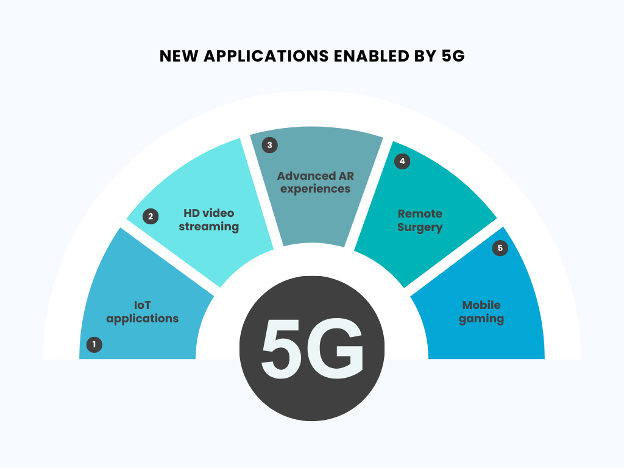
While 4G provides fast mobile internet, the fifth generation of wireless technology offers speeds 100 times quicker. 5G means amplified mobile connectivity, allowing for downloads, uploads, and streaming of HD videos at a considerably higher rate with much enhanced reliability. 5G is also the best fit for IoT applications. This would include smart homes, smart cities, and industrial IoT—cases when many devices must integrate and process data in real time.
5G’s ultra-fast speeds will significantly impact mobile traffic:
- Increased Data Consumption: Users will be encouraged to download and stream more HD videos and VR content due to the faster speeds.
- Rise of New Applications: 5G’s low latency and high capacity will enable new applications like mobile gaming with real-time responses, remote surgery with minimal delay, and advanced AR experiences.
Evolving Network Management: Mobile network operators must develop new strategies to handle increased traffic and diverse applications. This includes traffic prioritisation, network slicing for different data types, and more innovative data caching techniques to maintain a smooth user experience.
The rise of mCommerce
The mCommerce industry has proliferated due to the increased number of smartphone users. Here, convenience reigns, as consumers can buy products and services anywhere on their mobile devices.
Here are the current trends in mCommerce affecting mobile traffic:
- Social networking platforms have now added shopping features within their app, allowing users to window shop, buy, and view demos for products without leaving the app. This smooth shopping experience encourages impulse purchases and is one of the biggest mobile traffic drivers.
- Livestream shopping is a real-time product demo through live video streaming that drives engagement and purchases on mobile.
- Companies practice omnichannel marketing. They unify the shopping experience across their online sites, brick-and-mortar stores, and mobile applications. Capabilities like ‘click and collect’ and in-store product scanning through mobile apps increase engagement.
- Easy and secure mobile wallets like Apple Pay and Google Pay make checkout processes more manageable. This frictionless payment experience sets abandonment rates low and mobile purchases high.
Final Thoughts
Growth in mobile internet traffic is a sure sign of diversification and innovation. Mobile phones are no longer just communication devices. They’re tools to consume content and help make your everyday life easier. Understanding the intricacies of mobile consumption and traffic can help you create a more impactful marketing strategy. Look into the above-mentioned data and see how these insights can help you shape your next campaign.